Data Analysis & Reporting: Precise Insights for Your Production
Turn your machine and production data into measurable competitive advantages! With Clouver, you identify production bottlenecks, analyse contextual data and derive well-founded needs for action – directly based on your operational reality.
Production insights in real time
The 3 central challenges in production data analysis
1. Distributed data sources without connection
Production data is stored in isolated systems and is difficult to compare or interpret.
- High effort for manual consolidation
- Different formats prevent comparability
- Lack of overall view of production processes
- No continuous view of the value chain
2. Bottlenecks & losses remain undiscovered
Lack of transparency means that critical weaknesses in the process remain undetected.
- No visual representation of causes
- Correlations between key figures unclear
- Automated analyses missing
- Reactive instead of proactive decisions
3. Environmental data is ignored
Important production factors such as temperature, humidity or light conditions are not included in evaluations.
- Influence on quality or throughput remains hidden
- No correlation between environmental conditions & output
- Problems with reproducibility
- Incorrect assumptions about causes of errors
How Clouver makes your data valuable for decisions
Clarity at a Glance – with Clouver Dashboards
To analyse complex production processes efficiently, clear and intuitive data visualisations are essential. Dashboards in Clouver consolidate all relevant information in a central interface – role-based, up-to-date, and clearly structured.
This ensures that all stakeholders – from the Production Manager to executive leadership – receive exactly the data they need to make well-informed decisions. Production KPIs, environmental conditions and system statuses are logically linked, visualised, and placed in the right context.
All data sources – bundled in one analysis platform
Clouver combines machine, process and environmental information in a central analytics dashboard for your production.
- Fully automatic data acquisition from BDE, MDE and sensors
- Standardisation of different sources and formats
- Clear visualisation of correlations
- Time series and event analyses at the touch of a button
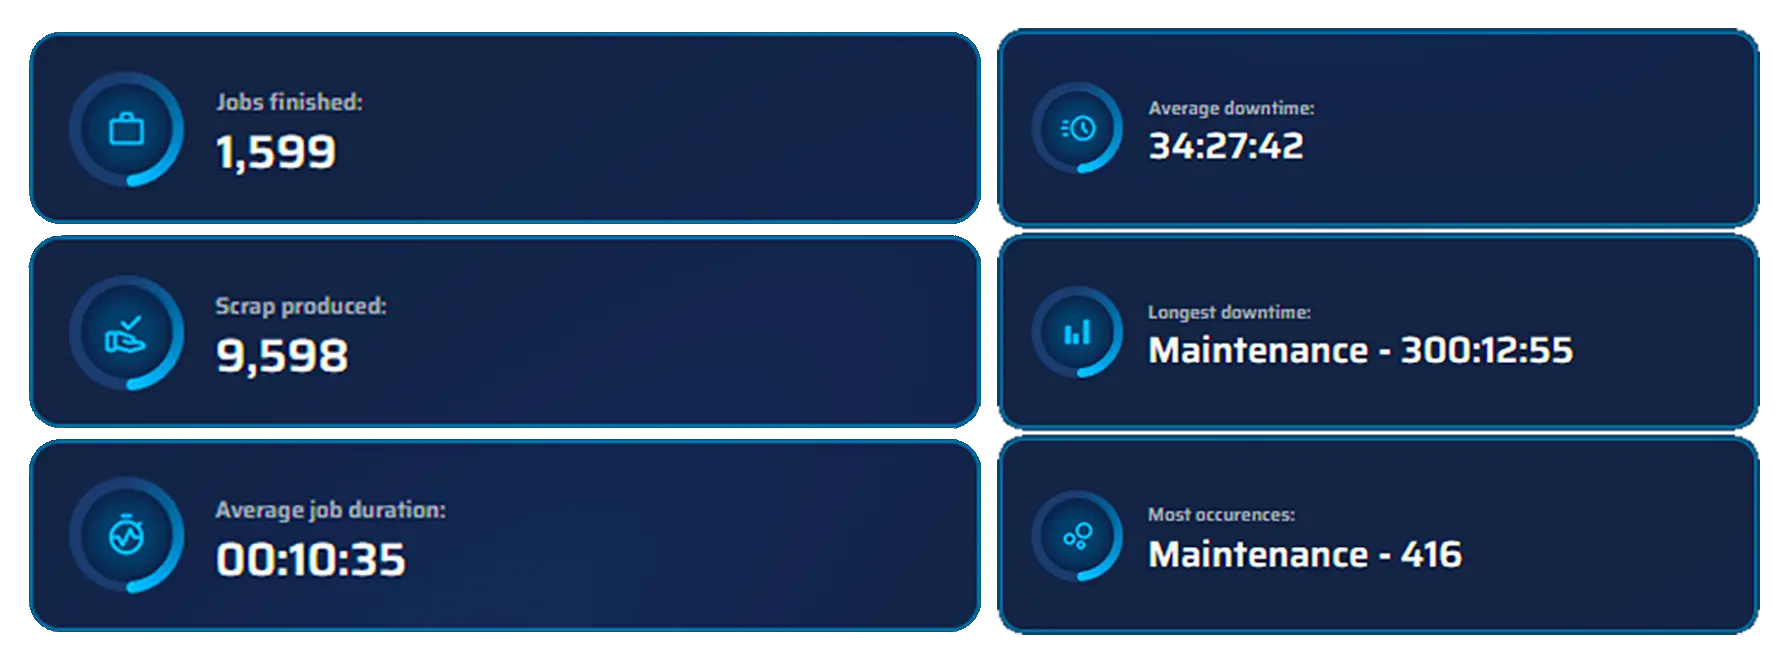
Identify bottlenecks before they become costly
Locate delays, bottlenecks and quality risks – data-based, without additional effort.
- Continuous monitoring of all process steps
- Throughput and cycle time analyses
- Prioritisation by economic impact
- Display downtimes
Production environment integrated into your analyses
Temperature, humidity and other parameters are correlated with your manufacturing data – for complete transparency.
- Automated recording of relevant environmental data
- Early detection of environment-related problem sources
- Quality forecasts based on real conditions
- Basis for reproducible production quality
Clouver Data Analysis & Reporting – your tools at a glance
Central Analysis Page
- Comprehensive visualisation of all production KPIs
- Dashboards for management, engineering & quality assurance
Bottleneck & throughput reports
- Identification of critical process points
- Historical development & comparison with targets
Environmental data evaluation
- Live data of temperature, humidity etc.
- Correlations with quality and output quantities
- Clarity about influencing factors on productivity
Analysis Cloud & Data Warehouse
- Central data storage with structured long-term archiving
- Retrievable timelines & benchmarking
- Export functions for further BI systems
System integration via API
- REST API for your ERP, MES or BI solutions
- Webhooks for process-driven interactions
- Fully documented and standardised
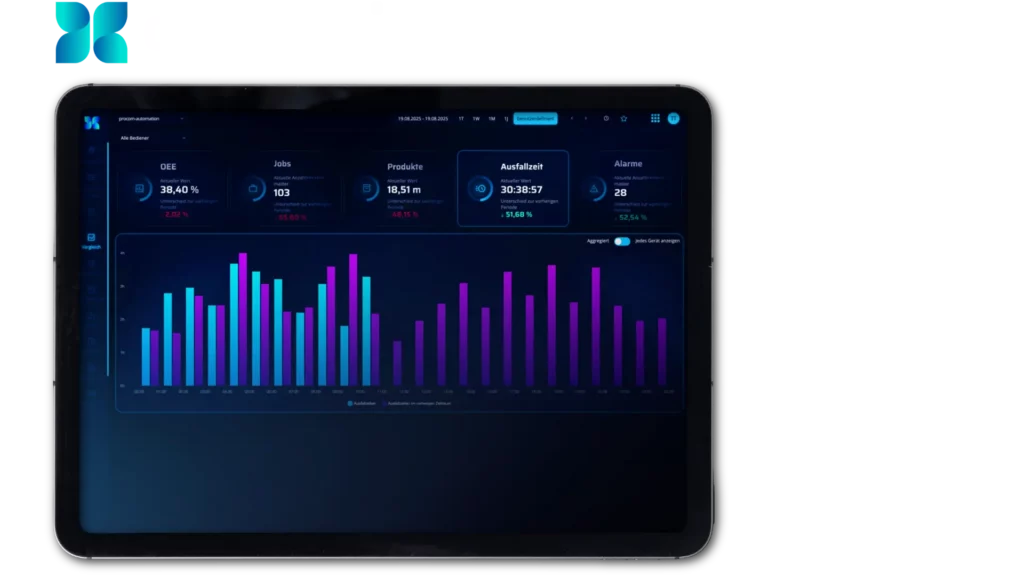
Mobile dashboards
- Access via smartphone & tablet
- Individually configurable KPI displays
- Role-defined views for different user groups
What you achieve with Clouver in a short time
bottlenecks recognised faster
savings per year possible
“Clouver significantly simplifies our monthly billing of energy distribution. We can now conveniently and centrally access all relevant meter readings of the PV system as well as the various energy and water meters, without having to read them on site in a time-consuming manner.”
Discover your optimisation potential – data-based and reliable
Numerous companies are already using Clouver to evaluate their production data. Start now with a live analysis of your processes.