Smart Factory: The Ultimate Guide 2026
9. February 2026
The Smart Factory is the heart of modern industrial manufacturing: a highly networked, self-organizing production environment in which people, machines,…


26. June 2026
Key Takeaways
Yesterday’s sewing line achieved 92% efficiency. Today, with a new style and the same operators, efficiency dropped below 70%. Nothing changed on the machine side—but one operation suddenly became the bottleneck.
This is the reality of garment line balancing. Unlike automotive or electronics assembly, where products stay the same for months, sewing factories deal with style changes every few days. A line that was perfectly balanced yesterday can become chaotic today because a new fabric requires different thread tension, a tighter seam allowance adds seconds to every stitch, or one operator hasn’t yet built the muscle memory for a new collar shape.
During projects with apparel manufacturers in Southeast Asia, we repeatedly observed that the bottleneck was not the oldest machine—but the sewing operator with the highest style complexity. The machine ran fine. The operator struggled with a new seam type, and bundles piled up within the first hour.
This is where line balancing manufacturing becomes a daily management discipline for sewing factories, not just a one-time lean exercise.
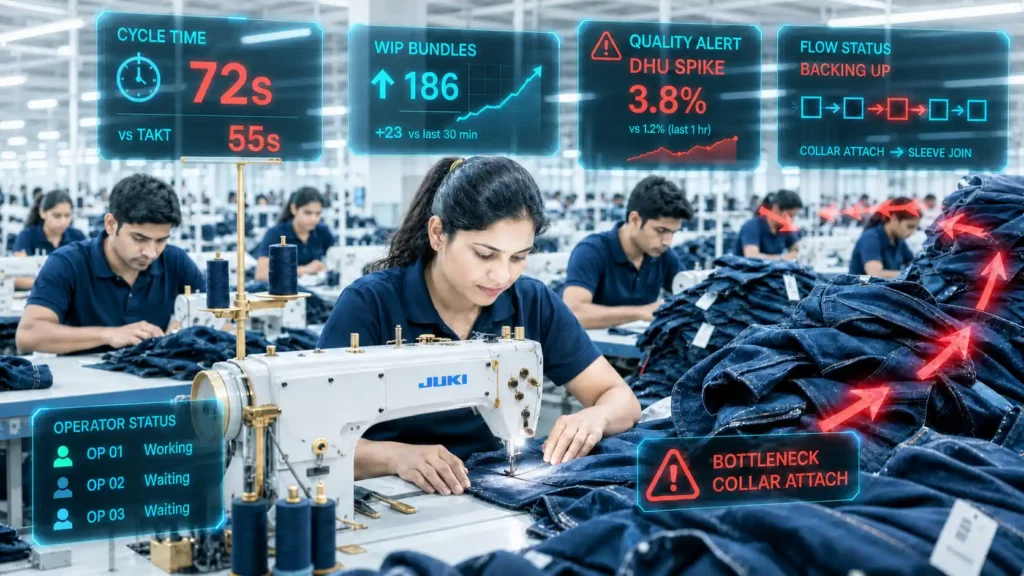
Before you start a line balancing project in your textile plant, look at the full production process. Don’t start with software or buying a new sewing machine. Start with the flow.
Ask three questions that every experienced line supervisor already knows intuitively:
These answers show where the line loses time. Also check whether the problem is stable. A fixed bottleneck at collar attachment needs a different action than a bottleneck that moves between sleeve join and pocket sewing depending on the operator or the fabric weight.
In our experience working with multi-line garment factories, the most common mistake is assuming the bottleneck is where it was last week. After a style change, everything shifts. The line supervisor who checks flow before checking data makes better decisions than the one who stares at yesterday’s Excel report.
Line balancing means assigning work elements to workstations so each station’s cycle time fits the line’s takt time. If takt time is 60 seconds and a complex collar attachment operation needs 78 seconds, that station becomes the bottleneck. If a simpler hemming operation needs only 45 seconds, it has excess capacity. A balanced line reduces this gap without harming seam quality, safety, or ergonomics.
In sewing factories, line balancing includes manual handling, machine sewing time, thread changes, needle changes, inline inspections, bundle tracking, and non-value-added time such as waiting for the next bundle or adjusting thread tension after a needle breakage.
The critical difference to other manufacturing environments: sewing is highly operator-dependent. Two operators on the same machine, same style, same fabric can have cycle times that differ by 20% or more. This makes operator balancing on the sewing line as important as workstation balancing.
A poorly balanced sewing line is rarely visible through one KPI alone. In practice, your line supervisor and quality team should look for recurring patterns across several shifts and product styles.
| Symptom | What it indicates in Garment Manufacturing |
| Bundles pile up before a specific sewing operation | That operation (e.g., sleeve join) exceeds takt time or the operator struggles with the current style. |
| Finishing line or QC team waits for garments | The upstream sewing bottleneck restricts the entire production flow. |
| Sewing operator efficiency drops sharply after style change | The learning curve hasn’t been factored into the line balance. |
| High inline defects (DHU) at specific stations | Operators are rushing to keep up, leading to poor seam quality and needle breakage. |
| Standard time (SAM) differs drastically from real production time | Time studies are outdated or don’t reflect the actual fabric and seam complexity. |
| Bottlenecks move between shifts or operators | Skill levels, material supply, or machine setup are unstable. |
From our work with garment manufacturers running 20+ sewing lines, we’ve learned that the most dangerous bottleneck is the one nobody reports. A sewing operator who quietly absorbs a 15-second overload by skipping a quality step doesn’t show up as a bottleneck in your bundle tracking—but shows up later as a spike in endline defects.
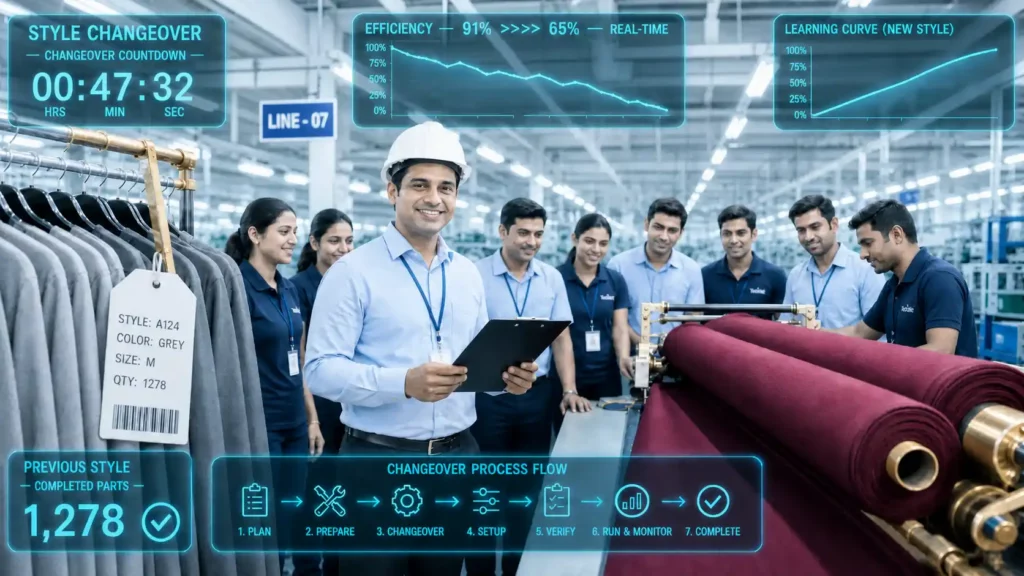
This is the single biggest challenge in sewing line balancing that generic manufacturing articles never address.
When a new style enters the line, almost everything changes simultaneously:
| Factor | What changes | Impact on line balance |
| New fabric | Different feed behavior, more or less stretch | Cycle time shifts unpredictably at multiple stations |
| Different seam allowance | Tighter tolerances, more precision needed | Operators slow down, especially at critical seams |
| Thicker material | Higher needle resistance, more thread tension | Needle breakage increases, micro-stops rise |
| New SMV | Planned standard times change | Old balance is invalid; new balance needed immediately |
| Thread tension adjustment | Machine setup required | Downtime at start of new style; first bundles often have defects |
| Needle change | Different needle type for different fabric | Setup time adds to first-hour inefficiency |
| Operator learning curve | New muscle memory needed | Sewing operator efficiency drops 15–30% in first hours |
| Different operation sequence | Precedence changes | Bundle flow and WIP distribution shift entirely |
In practice, we’ve seen factories lose an entire half-shift of productivity after a style change—not because the line wasn’t planned, but because the plan was based on SMV alone. The real production time during the learning curve was never measured, never tracked, and never fed back into the next balancing decision.
This is exactly where digital sewing line monitoring changes the game. If you can see real production time per operation during the style change, your line supervisor can rebalance within the first hour instead of discovering the problem at end-of-day reporting.
Good garment line balancing decisions need more than average cycle times. You need metrics that show customer pace, actual operator performance, workload distribution, and quality impact.
| Metric | What it measures | Why it matters for sewing |
| Takt time | Available time / customer demand | Sets the target pace. Changes with order volume. |
| Cycle time (Real Production Time) | Actual time at one station | Shows whether a sewing operator can meet takt with the current style. |
| OEE | Availability × Performance × Quality | Critical for evaluating sewing machine utilization across the line. |
| DHU (Defects per Hundred Units) | Quality metric | An unbalanced line spikes DHU as overloaded operators make mistakes. |
| Sewing line efficiency | Total work content / (stations × max cycle time) | The single most-watched KPI for line supervisors. |
| Operator efficiency | Individual output vs. target | Reveals skill gaps and learning curve effects after style changes. |
| Balance delay | 1 – line efficiency | Shows lost time caused purely by imbalance. |
| WIP / Bundle count | Buffers between stations | Reveals exactly where flow is interrupted. |
OEE alone is not enough. A sewing machine can show 85% OEE and still break the line rhythm if the operator’s cycle time exceeds takt time during a complex style. Combine OEE with operator efficiency and DHU to get the full picture.
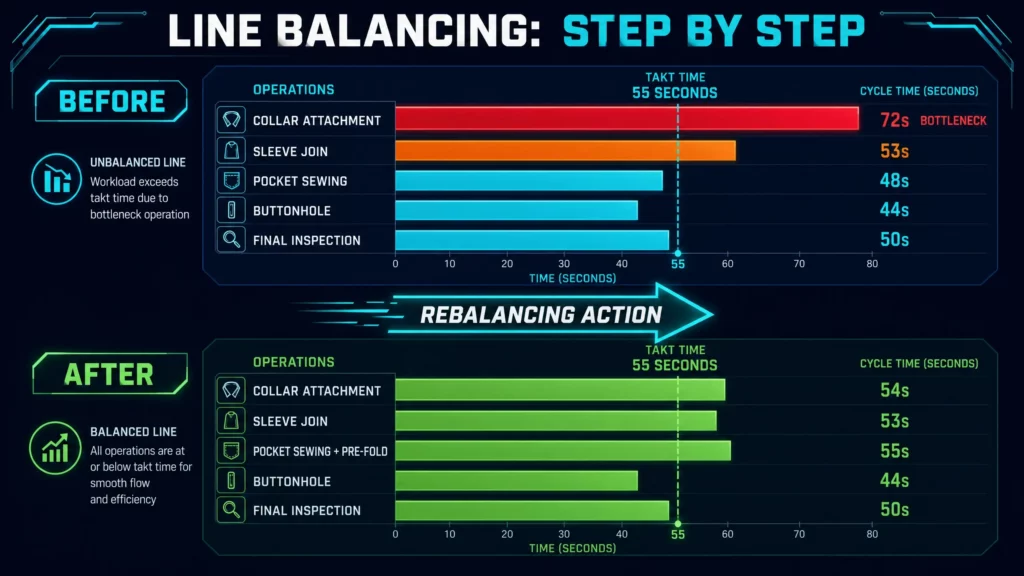
Your sewing line produces a men’s dress shirt. Takt time is 55 seconds. The line has five key operations. After measuring real production time (not just SAM from the tech pack), you find:
| Operation | Current Real Time | Interpretation |
| Collar Attachment | 72 s | Bottleneck – exceeds takt by 17 s |
| Sleeve Join | 53 s | Close to takt |
| Pocket Sewing | 48 s | Excess capacity |
| Buttonhole | 44 s | Excess capacity |
| Final Inspection | 50 s | Below takt |
Collar attachment is the constraint. Bundles pile up before it. The finishing line waits. DHU is rising because the collar operator rushes to keep pace.
A line balancing workshop breaks the collar operation into sub-elements. The pre-fold and marking step (12 seconds) can move to the pocket operator, who has 7 seconds of excess capacity. An additional support operator handles the collar pressing, which frees 8 seconds.
| Operation | New Real Time | Result |
| Collar Attachment | 54 s | Now meets takt |
| Sleeve Join | 53 s | Unchanged |
| Pocket Sewing + Pre-fold | 55 s | Close to takt, capacity used |
| Buttonhole | 44 s | Still below takt |
| Final Inspection | 50 s | Unchanged |
The line now flows. But here’s what we’ve learned from real garment factories: this balance will hold for this style. When the next style arrives with a different collar construction, you need to rebalance again. That’s why sewing bottleneck analysis must be continuous, not a one-time project.
A line balance is only as reliable as the data behind it. Traditional garment line balancing uses time studies, spreadsheets, and engineering judgment. You calculate the SMV, assign operators, and hope it works.
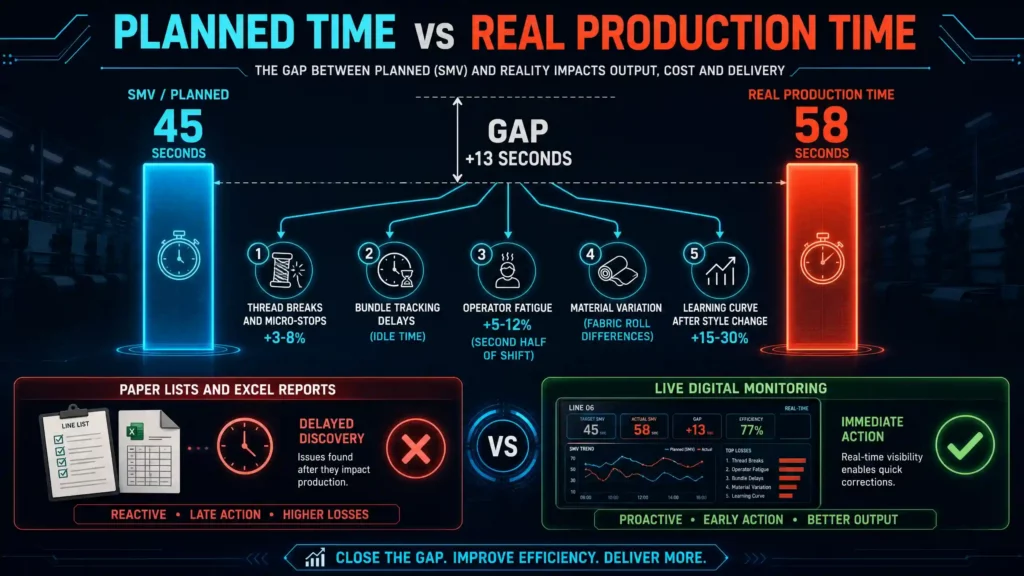
But planned time rarely matches real production time. Here’s why:
If your line supervisor relies on paper lists or end-of-day Excel reports, they discover these gaps too late. The shift is over. The damage to sewing factory productivity is done.
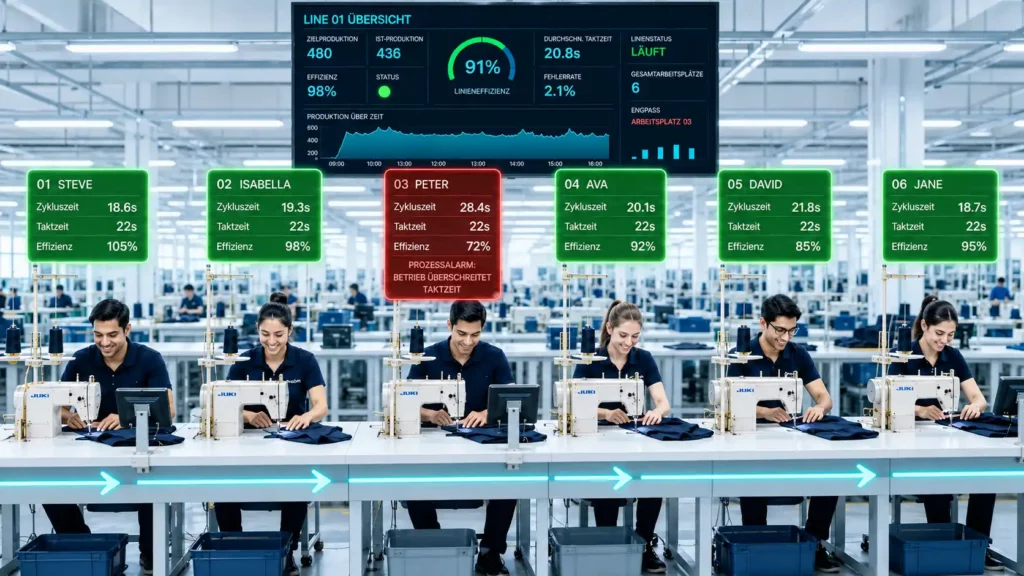
Traditional line balancing—time studies, Yamazumi charts, precedence diagrams—remains valuable. An experienced line supervisor who walks the floor and observes bundle flow is irreplaceable.
But the limits appear when your production environment becomes dynamic. And in Asian garment manufacturing with fast-fashion orders, short runs, and frequent style changes, dynamic is the default.
Digital apparel production monitoring closes this gap. Instead of waiting for end-of-shift reports, a garment production dashboard captures machine states, production counts, downtime, and quality events directly from the sewing machines—in real time.
This doesn’t replace your line supervisor. It makes their decisions faster and more precise. When you can compare planned time with real production time live, you can adjust the line setup within the first hour of a new style instead of losing half a shift.
From our experience deploying monitoring systems in textile factories across Asia: the factories that improved fastest were not the ones with the best initial data. They were the ones where line supervisors trusted the live data enough to act on it immediately.
For textile hubs operating across multiple plants, getting accurate data from a heterogeneous mix of older and newer sewing machines is a strategic challenge. Different brands (Brother, Juki, Dürkopp Adler, Pfaff), different ages, different signal types—and yet you need one consistent garment production dashboard across all lines.
This is where Clouver by ProCom Automation provides a decisive advantage. Clouver captures machine-level signals non-invasively and brand-independently. It connects to virtually any industrial sewing machine—whether legacy or new—and delivers:
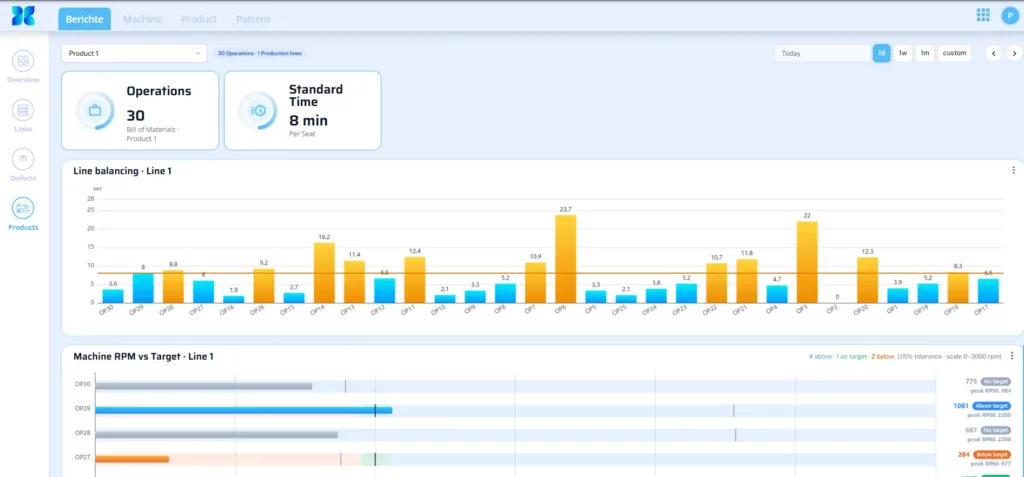
Clouver picks up where ERP systems typically fall short in terms of real-time performance: right on the shop floor.The platform collects machine data in real time, visualizes it in dashboards, and can exchange relevant information with existing ERP or MES systems. This means teams don’t have to wait for end-of-day reports; instead, they can identify during their shift which station is falling out of sync.
ProCom Automation brings more than 40 years of experience in industrial automation to the table. We know that a few manual time measurements per day are often not enough to reliably assess the actual workload of a sewing station. Clouver supplements these snapshots with continuously collected production data. This allows your team to see how long individual work processes actually take—and to identify bottlenecks based on reliable real-time data.
Line Balancing Manufacturing in sewing factories combines industrial engineering, operator management, and live production data. A balanced sewing line improves flow, reduces inline defects, increases sewing factory productivity, and helps you meet tight delivery deadlines.
The strongest results come when your line supervisors combine shop floor observation with reliable, real-time data. Time studies show an important snapshot. But apparel production monitoring shows how the line actually performs—across styles, operators, and shifts.
The factories that win are not the ones with the perfect initial plan. They’re the ones that detect imbalance within minutes and rebalance before the shift is lost.
Request a demo of sewing factory monitoring and see how Clouver integrates live shop floor data with your existing ERP and production systems for more precise sewing line balancing during the current shift.
In garment manufacturing, workforce skill variation and handling of flexible materials (fabric) create high variability in cycle times. Balancing a sewing line requires a stronger focus on operator skill matrices, managing inline defects (DHU), and dealing with frequent style changeovers. Unlike rigid assembly, every new style can invalidate the previous balance entirely.
A style change introduces new fabric, new seam allowances, different thread tension requirements, and an operator learning curve—all simultaneously. The SMV changes, but the real production time during the first hours is typically 15–30% higher than planned. Without live monitoring, this gap remains invisible until end-of-shift reporting.
Manual time studies (SMV) represent a perfect scenario. Real-time data captures reality: micro-stops from needle breakage, thread breaks, bundle waiting time, and operator fatigue. Live data allows line supervisors to compare planned time with real production time and rebalance during the shift—not the next day.
If a sewing operator is overloaded (exceeding takt time), they often rush, which increases inline defects. These defects require rework, adding unplanned cycle time and worsening the bottleneck. Tracking DHU alongside cycle time and operator efficiency is essential for true garment line balancing.
Clouver is designed to complement existing ERP and MES systems. Production data is collected directly from machines, sensors, or workstations and can be exchanged with the ERP system depending on the available interface. This provides a real-time view of the shop floor, while the ERP system continues to be used for planning, orders, and higher-level business processes.
In high-mix garment production, you should review the balance after every style change, after major demand shifts, and whenever sewing line efficiency drops below your target. Factories running 3–5 style changes per week need near-continuous balancing capability—which is why live data matters more than periodic time studies.

About the Autor
Tanja is Head of Digital Marketing at ProCom Automation and writes practical articles on CNC, IIoT, Industry 4.0 and efficient manufacturing. The content is developed and technically reviewed in close collaboration with our Clouver IIoT monitoring and CNC experts.



You are currently viewing a placeholder content from Google Maps. To access the actual content, click the button below. Please note that doing so will share data with third-party providers.
More InformationYou are currently viewing a placeholder content from OpenStreetMap. To access the actual content, click the button below. Please note that doing so will share data with third-party providers.
More InformationYou are currently viewing a placeholder content from Facebook. To access the actual content, click the button below. Please note that doing so will share data with third-party providers.
More InformationYou need to load content from reCAPTCHA to submit the form. Please note that doing so will share data with third-party providers.
More InformationYou need to load content from Turnstile to submit the form. Please note that doing so will share data with third-party providers.
More Information