Automotive Sewing Case Study: What 12 Weeks of Machine Data Reveal
29. October 2026
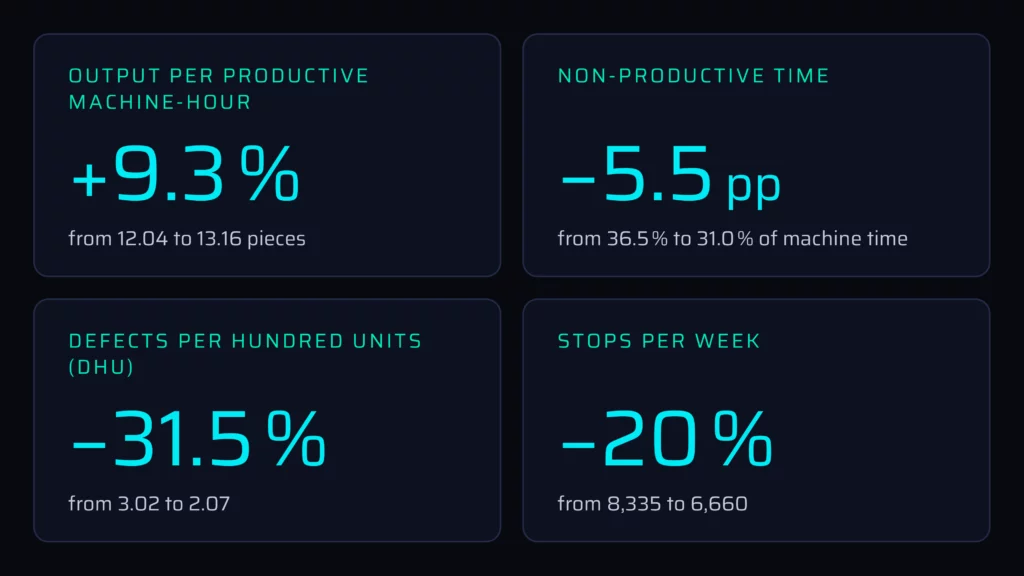
In a 12-week Clouver pilot on an automotive sewing line with 10 machines, output per productive machine-hour rose by 9.3%, defects per hundred units fell by 31.5% and stops per week fell by 20%. None of these gains required new machines. They came from a team acting on what the machine data made visible. This case study shows the figures, how they were measured and what their limits are.
The customer is an automotive supplier in Asia. For confidentiality reasons we cannot name the company or show photos from the shop floor. Every figure in this article was measured directly on the machines and has not been adjusted. If you want to know how the measurement itself works, see our overview of Clouver IIoT monitoring.
Key figures at a glance
Metric
Week 4 (first full production week)
Week 12 (last pilot week)
Change
Output per productive machine-hour
12.04 pieces
13.16 pieces
+9.3%
Non-productive time (share of machine time)
36.5%
31.0%
−5.5 percentage points
Defects per hundred units (DHU)
3.02
2.07
−31.5%
Machine stops per week
8,335
6,660
−20%
Station time at the slowest station
44.6 s
39.5 s
−11.5%
The Right First Time rate reached 97.9% in the last pilot week. Across the whole pilot, 38,033 pieces were inspected at the end of the line.
The pilot setup: one line, ten machines, twelve weeks
The pilot ran on one sewing line in automotive production. The line has 10 sewing machines and produces one product in several variants (left and right versions). Clouver captured four data streams:
machine states (productive, idle, stopped, switched off)
piece counts
energy consumption per machine
the result of the end-of-line quality inspection for every piece
The twelve weeks fell into three phases:
Weeks
Phase
Used for comparisons?
1 to 3
Commissioning, no operator logged in yet
No
4 to 6
Operator training
Yes, flagged
7 to 12
Stable operation
Yes
All comparisons in this article therefore run from week 4 to week 12. The commissioning weeks behave differently in the data and are excluded.
Output: +9.3% per productive machine-hour
Output per productive machine-hour rose from 12.04 to 13.16 pieces. This metric divides the number of finished pieces by the hours in which the machines were actually sewing. It does not depend on whether operators logged in at the machine, so it stays comparable from week to week.
The increase did not happen gradually. It coincides with the end of operator training. For a plant manager this is a useful finding in itself: the length and quality of training show up directly in the output figure, which makes training a measurable cost factor.
Downtime: 2.6% of stops cause almost half of the lost time
Stops per week fell from 8,335 to 6,660. The typical stop duration (median) stayed at 15 seconds throughout. The improvement therefore came from preventing stops, not from clearing them faster.
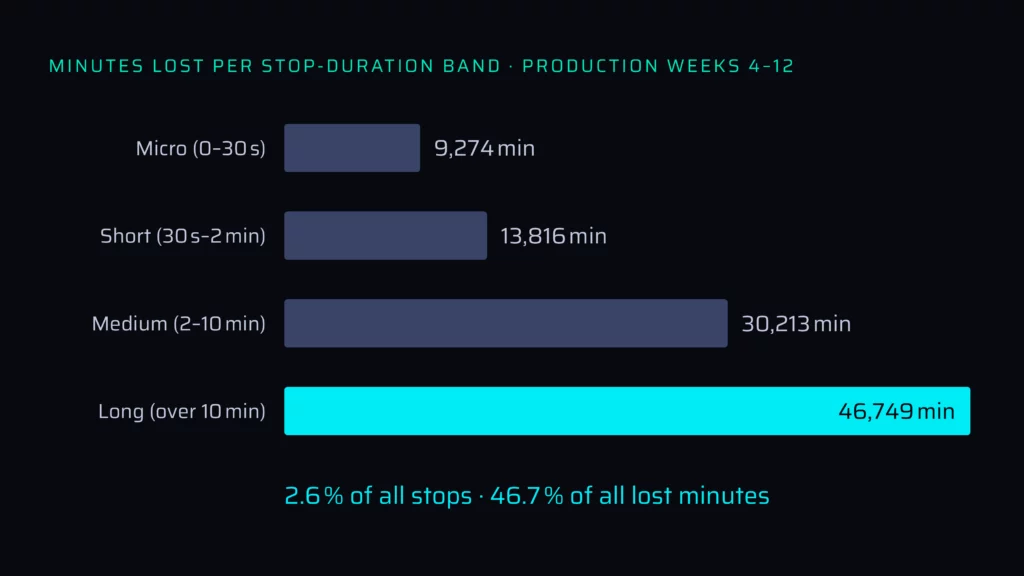
The key insight is how the lost minutes are distributed across stop lengths (production weeks 4 to 12):
Stop duration
Minutes lost
Share of lost minutes
Micro (0 to 30 s)
9,274
9.3%
Short (30 s to 2 min)
13,816
13.8%
Medium (2 to 10 min)
30,213
30.2%
Long (over 10 min)
46,749
46.7%
Stops longer than 10 minutes make up only 2.6% of all stops but 46.7% of all lost minutes. At the other end, 70% of all stops last less than 30 seconds. Nobody with a stopwatch and a clipboard can capture micro-stops at this scale. Sensors on every machine can.
What this means in practice: an escalation rule for every stop that runs longer than 10 minutes. That is a supervisor instruction, not an investment.
Idle time: for a third of the powered-on time, the needle does not move
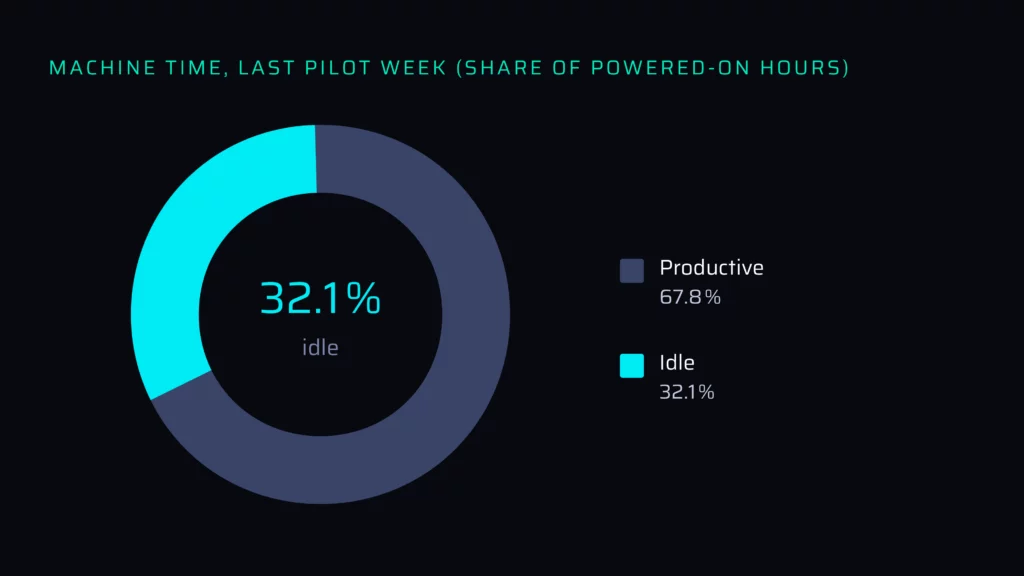
In the last pilot week, the machines were productive for 67.8% of the time they were switched on and idle for 32.1%. Measured against all shift hours, including the time the machines were switched off, the idle share hardly moved during the pilot (30.7% at the start, 30.9% at the end), while the output per productive hour went up.
This means the line’s largest remaining reserve is still untapped. Idle time is capacity that has already been paid for: the machine is on, the operator is present, but nothing is being sewn. Unlocking it requires better material flow and work distribution, not new equipment. Measuring this share continuously is also what OEE optimisation is built on.
Capacity: 123 seconds per piece that no one was using
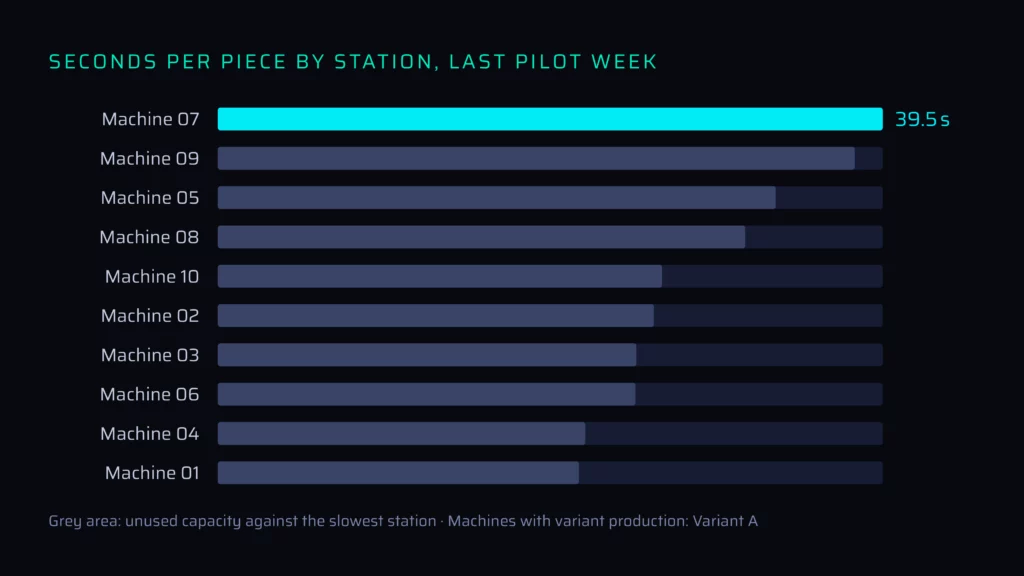
The data shows the seconds each station needs per piece. In the last pilot week, the slowest station needed 39.5 seconds, down from 44.6 seconds at the start (−11.5%). Measured against that station, the other stations together had 123 seconds of unused capacity per piece. The balance between stations improved from 69.5% to 74.0% during the pilot.
Two details only became visible through continuous measurement:
The slowest station moved between two machines during the pilot. A one-off time study would have caught only one of them.
Redistributing work around the current slowest station frees this capacity without buying a single machine. The estimated effort is one to two days.
Every piece leaving the line was inspected at the end of the line. The result, the defect type and the responsible station were recorded for each piece. Over the whole pilot, 1,185 defects were recorded:
Defect type
Count
Open seam
438
Seam margin out of spec
221
Slack stitch
197
Improper stitch
78
Pinched seam
33
Other types
218
The top three defect types account for almost three quarters of all defects. Two further findings:
One station caused 20 times as many defects as the best station.
In the production weeks, 810 of 811 defects could be reworked. The defect rate is therefore mainly a rework cost, not a scrap cost.
DHU (defects per hundred units) fell from 3.02 to 2.07 during the pilot. A quality programme that targets the three most frequent defect types addresses most of the problem with the fewest changes.
Energy: 19.4% is consumed while the machines are idle
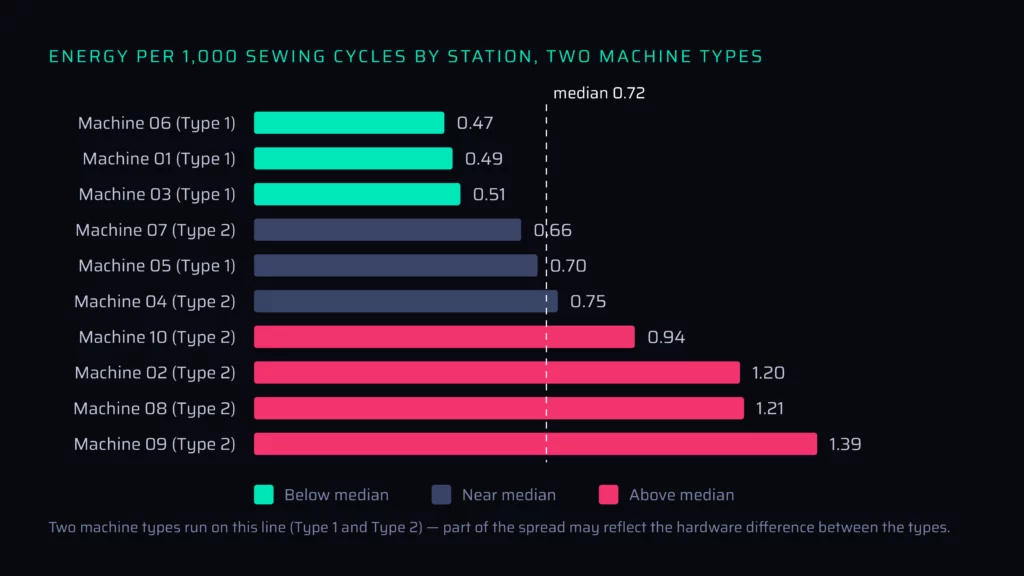
Energy savings were the benefit the customer expected most. Of 908 kWh measured over the twelve weeks, 176 kWh (19.4%) were drawn while the machines were idle.
The comparison per 1,000 sewing cycles shows how much consumption varies between stations:
Machine
Type
kWh per 1,000 sewing cycles
Machine 06
Type 1
0.47
Machine 01
Type 1
0.49
Machine 03
Type 1
0.51
Machine 07
Type 2
0.66
Machine 05
Type 1
0.70
Machine 04
Type 2
0.75
Machine 10
Type 2
0.94
Machine 02
Type 2
1.20
Machine 08
Type 2
1.21
Machine 09
Type 2
1.39
The median is 0.72 kWh. Two machine types run on this line, so part of the spread reflects the hardware. Even within Type 2, however, consumption ranges from 0.66 to 1.39 kWh, roughly a factor of two. Reducing idle consumption is a question of shutdown routines, not investment.
What only measurement reveals
Three figures did not exist before the pilot. All of them are machine-measured, not estimated:
Finding
Figure
Basis
Variant changeover
3% performance loss per left/right change
526 changes measured
Overtime
13% of all sewing cycles after the regular shift
Overtime on 33 of 63 production days
Micro-stops
70% of all stops shorter than 30 seconds
Every stop on every machine
The changeover figure is particularly relevant for planning. Switching between left and right variants of the same product costs far less than a full style change would.
Maintenance data shows a similar effect. Machine 04 needed the technician most often (26 calls, on average 3.9 minutes each). Machine 03 lost the most time (196 minutes in total, on average 17.8 minutes per stop). The machine with the most technician calls is not the one that loses the most time. The two problems need different answers, and both are only visible when every stop is recorded.Four levers without investment
Every lever comes directly from the pilot data:
No.
Lever
Data basis
01
Redistribute work around the current slowest station
123 s of unused capacity per piece
02
Quality programme for the three most frequent defect types
Almost three quarters of all defects
03
Investigate the station with the most defects
20 times the defects of the best station
04
Escalation rule for stops longer than 10 minutes
46.7% of all lost minutes
How the figures were derived and what their limits are
Figures are only as useful as the method behind them. The most important points:
Comparisons within the pilot. Measurement started at commissioning. There is no measured baseline from before the installation and no control line. All changes compare the line with itself over time.
Commissioning and training are separated. Weeks 1 to 3 are excluded, weeks 4 to 6 are flagged. Part of the improvement coincides with the end of operator training.
One line, one product. The results describe this line. They cannot be transferred directly to other lines or products.
The headline figure does not depend on login discipline. Output per productive machine-hour is based on machine states, not on operator logins.
Four simple working habits keep the data meaningful: entering a reason code for every stop above a minimum duration, logging in at the machine, keeping daily targets and master data up to date, and a short one-off calibration session among the quality inspectors.
Clouver makes it visible, the team makes it happen
Clouver is the monitoring system. It measures every machine, every stop and every piece and turns them into live KPIs. It does not change the line by itself. The improvements in this pilot came from people acting on what the data showed them.
A Clouver pilot runs in three steps:
Setup and training: the machines are connected without touching their control logic. Once data is flowing, the team is trained to work with it.
Pilot phase: the line runs with live data for an agreed period until the KPIs stabilise and the concrete levers become visible.
Impact review: an impact report with your own KPIs and concrete recommendations forms the basis for the next decision.
Scope, timeline and prerequisites are agreed before the start.
Tanja is Head of Digital Marketing at ProCom Automation and writes practical articles on CNC, IIoTIIoT is the internet-based networking of industrial machines, systems, and devices for data collection and process optimization., Industry 4.0Fourth industrial revolution through digitalization and intelligent networking of production facilities. and efficient manufacturing. The content is developed and technically reviewed in close collaboration with our Clouver IIoT monitoring and CNC experts.
You are currently viewing a placeholder content from Google Maps. To access the actual content, click the button below. Please note that doing so will share data with third-party providers.
You are currently viewing a placeholder content from OpenStreetMap. To access the actual content, click the button below. Please note that doing so will share data with third-party providers.
You are currently viewing a placeholder content from Facebook. To access the actual content, click the button below. Please note that doing so will share data with third-party providers.